This module provides online access to key information and data that supports Natural Reource Management (NRM) Reporting. Information on natural resource condition informs policy at national and state levels, and underpins management at regional and local scales.
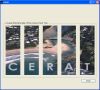 Coastal Eutrophication Risk Assessment Tool (CERAT)
The NSW Office of Environment and Heritage has developed a coastal eutrophication risk assessment tool, which integrates the latest natural resource management data into catchment export and estuarine response models for every major estuary in NSW.
The tool allows natural resource mangers to review interactions between land use planning and estuarine health before investment decisions are made. More on CERAT

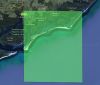
 Habitat extent, distribution & monitoring
Make maps of habitats dominated by: mangroves, salt marsh, seagrass, coral, rock, sediment and unconsolidated substrates.
 Shallow water spectral library
Location of seagrass, macroalgae and coral spectral libraries;
Field spectroradiometers loan service;
A Field Guide for Spectral Measurements;
Spectroradiometer Cookbook
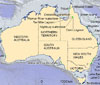
 Quickbird images acquired for Australia’s coastline
View Quicklooks
To order: For any queries about accessing data and licence requirements, please refer to the information in Geoscience Australia’s (GA) web site or contact the GA Sales Centre on 1800 800 173
 Environmental management framework
Find out how current understanding planning approaches and participating processes work in developing implementing and reviewing integrated catchment plans.

 Miscellaneous Tools
Build a conceptual model,
Numerical modelling links;
Coastal stakeholder search,
Regional plans and strategies
Background
Australian state, territory and local governments are investing considerable effort and funds into natural resource management (NRM), through programs such as the National Action Plan for Salinity and Water Quality (NAP) and the National Landcare Program (NLP). The National Monitoring and Evaluation Framework (NM&EF) was established in 2002 to assess the health of Australia’s land, water and biological resources, and the performance of government programs. The framework includes a series of broad themes or Matters for Target, which can be reported against using a range of indicators and report cards. Estuarine, coastal and marine (ECM) is one of ten biophysical matters for target.
NRM Reporting
The NM&EF supports the timely dissemination of accurate information on resource condition to ensure that investments are directed to the areas of highest priority and to assess the effectiveness of the national policies, strategies and programs. Information on resource condition informs policy at national and state levels, and underpins management at regional and local scales. The NRM reporting module was developed in collaboration with the National Land and Water Resources Audit (NLWRA) and State and Territory governments. It complements the Environmental Management module and the content is supported by the Conceptual Models facility and Coastal Indicator Knowledge and Information System. The module accommodates the national NRM ECM indicator protocols, and has data exploration tools for viewing information that relates to Habitat Extent, Distribution and Monitoring and Report Card reporting.
Report Card Facility
The ECM Report Card Reporting tool allows users to view aggregated (“national”) report scores and trends (if available) against year, at a range of different spatial scales including national, states, regional (CMA’s, NRM zones and LGA’s) and bioregional (IMCRA and Marine Planning regions), and to get a statistical breakdown of the scores for the area selected. The map interface shows the reporting regions (estuaries) as dots with a colour coding that matches that of the condition assessment in the pie chart. The dialogue box in the bottom right hand corner of the screen (entitled monitoring sites) provides hyperlinks to more detail on the report cards and other information behind the assessments. The assessment level of a report card is found adjacent to the hyperlinks. These assessment levels pertain to the Environmental Condition Assessment Framework or ECAF1. There are three assessment levels in the ECAF framework: first pass (supporting understanding), second pass (supporting prioritising) and third pass (supporting adaptive management)1. The condition classification dataset from the first NLWRA2 comprises the first year of data in the tool.
There are also interactive tools to capture the more individualistic approaches of the States or regional groups to report carding and monitoring. For example, the Burnett Mary region (QLD) reports against condition and risk using a range of different stressors3. The functionality in OzCoasts allows users to view the distribution and statistical breakdown of the scores for each of the different stressors listed in both the condition and risk fields. More detailed information about the indicators results behind the stressors will be made available at the Burnett Mary website constituting the second tier in the web-reporting process3.
Habitat Extent, Distribution and Monitoring Reports
The Habitat Extent, Distribution and Monitoring interface comprises high spatial resolution polygons as mapped by the state agencies and thematically attributed with the recently agreed National Intertidal/Sub-tidal Benthic (NISB) Habitat Classification scheme4. The NISB classification scheme was developed as part of a collaborative project between the Department of Climate Change (DCC) and the NLWRA to address the need for both a: (i) a first pass vulnerability assessment of the whole Australian coastline; and (ii) national extent and distribution mapping of key estuarine, coastal and marine habitats to support the development of marine ‘ecoregions’ or bioregional subregions. The habitat classes occur between the location of the outer limit of the photic benthic zone (approximately at the 50-70 m depth contour) and the approximate position of the highest astronomical tide mark (HAT), and include: coral reef, rock dominated habitat, sediment dominated habitat, mangroves, saltmarsh, seagrass, macroalgae and filter feeders (e.g. sponges). An account of the process for developing the map series and the resulting scheme are provided in4.
There are national, state and regional summaries that comprise vector polygon layers of 10 and 50 km grid cells with a colour coding that indicates whether a habitat is present, absent or unknown within a given grid cell5. The grid cells have 50 km grid spacings at the National scale, and 10 km spacings at the state and regional levels. The summary maps are designed to help users to visualize the occurrence of the habitats around the continent because the high spatial resolution NISB Habitat Maps are difficult to see when displayed at National and State scales. These maps also serve the purpose of depicting the nature of data availability around the continent. The national, state and regional summary maps will be made available through Research Data Australia via a web-map service. The actual habitat maps from some states (NT, TAS, SA, WA and most of QLD) are also accessible to users at scales 2.
Indicator protocols
A set of resource condition indicators was developed for the National NRM M&E Framework in 2003 to provide information on how to assess each Matter for Target. A Users Guide to these documents6 describes the national framework and provides lists of stressors and of indicators to measure the affect of the stressors on ecosystem condition (physicochemical and biological) and habitat extent.
References
- Mount, R.E. and P.J. Bricher, 2008a. Estuarine, Coastal and Marine (ECM) National Habitat Mapping Project, Project Report Version 1 February 2008. Spatial Science Group, School of Geography and Environmental Studies, University of Tasmania. Report to the Department of Climate Change and the National Land and Water Resources Audit, Canberra, ACT.
- NLWRA 2002. Australian catchment, river and estuary assessment 2002, Volume 1. National Land and Water Resources Audit.
- Scheltinga, D. and Tilden, J. 2008. Final Report on the “Development of report card content to trial local and national level reporting on estuaries in the Burnett Mary NRM region” project. Report to the National Land and Water resources Audit, April 2008. 10 pp. FARI Australia Pty Ltd. Including a CD containing the trial regional web pages.
- Mount, R., Bricher, P., and Newton, J. 2007. NISB Habitat Classification Scheme. Report to the National Land and Water Resources Audit.
- Mount, R.E. and P.J. Bricher, 2008b. Estuarine, Coastal and Marine (ECM) National Habitat Mapping Project, ECM National Habitat Map Series User Guide Version 1 February 2008. Spatial Science Group, School of Geography and Environmental Studies, University of Tasmania. Report to the Department of Climate Change and the National Land and Water Resources Audit, Canberra, ACT. ECM National Habitat Map Series User Guide.
- Scheltinga, D. M., R. Counihan, A. Moss, M. Cox and J. Bennett (2004). Users’ guide for Estuarine, Coastal and Marine indicators for regional NRM monitoring. Cooperative Research Centre for Coastal Zone. Report was commissioned by the Australian Government Department of Environment and Heritage.
- Mount, R.E. and P.J. Bricher, 2008a. Estuarine, Coastal and Marine (ECM) National Habitat Mapping Project, Project Report Version 1 February 2008. Spatial Science Group, School of Geography and Environmental Studies, University of Tasmania. Report to the Department of Climate Change and the National Land and Water Resources Audit, Canberra, ACT. [↩] [↩]
- NLWRA 2002. Australian catchment, river and estuary assessment 2002, Volume 1. National Land and Water Resources Audit. [↩]
- Scheltinga, D. and Tilden, J. 2008. Final Report on the “Development of report card content to trial local and national level reporting on estuaries in the Burnett Mary NRM region” project. Report to the National Land and Water resources Audit, April 2008. 10 pp. FARI Australia Pty Ltd. Including a CD containing the trial regional web pages. [↩] [↩]
- Mount, R., Bricher, P., and Newton, J. 2007. NISB Habitat Classification Scheme. Report to the National Land and Water Resources Audit. [↩] [↩]
- Mount, R.E. and P.J. Bricher, 2008b. Estuarine, Coastal and Marine (ECM) National Habitat Mapping Project, ECM National Habitat Map Series User Guide Version 1 February 2008. Spatial Science Group, School of Geography and Environmental Studies, University of Tasmania. Report to the Department of Climate Change and the National Land and Water Resources Audit, Canberra, ACT. ECM National Habitat Map Series User Guide. [↩]
- Scheltinga, D. M., R. Counihan, A. Moss, M. Cox and J. Bennett (2004). Users’ guide for Estuarine, Coastal and Marine indicators for regional NRM monitoring. Cooperative Research Centre for Coastal Zone. Report was commissioned by the Australian Government Department of Environment and Heritage. [↩]